
The Pannonian Region and Its Climatic Setting
The Pannonian region sits like a natural bowl in the heart of Central Europe, and its geography strongly shapes the climate experienced across the basin. Figure 1 shows the average annual temperatures in the region for the period 1991–2020, based on ERA5T reanalysis data retrieved via the meteoblue DatasetAPI. The map reveals a largely uniform temperature pattern across the lowlands, with only subtle variations toward the surrounding higher terrain. Climate here is far more than just a backdrop: it plays a central role in shaping ecosystems and biodiversity, as the Pannonian Basin lies along a key boundary between wetter, forest-dominated regions and drier forest-steppe landscapes. Several climate influences converge in this area—moist Atlantic air affects the northwest, a more continental and drier climate dominates the east, and Mediterranean influences reach the southern parts, bringing warm summers and characteristic spring and autumn rainfall peaks. Together, these interacting climate systems give the Pannonian region its distinctive seasonal rhythm of cold winters, warm summers, and pronounced regional contrasts.
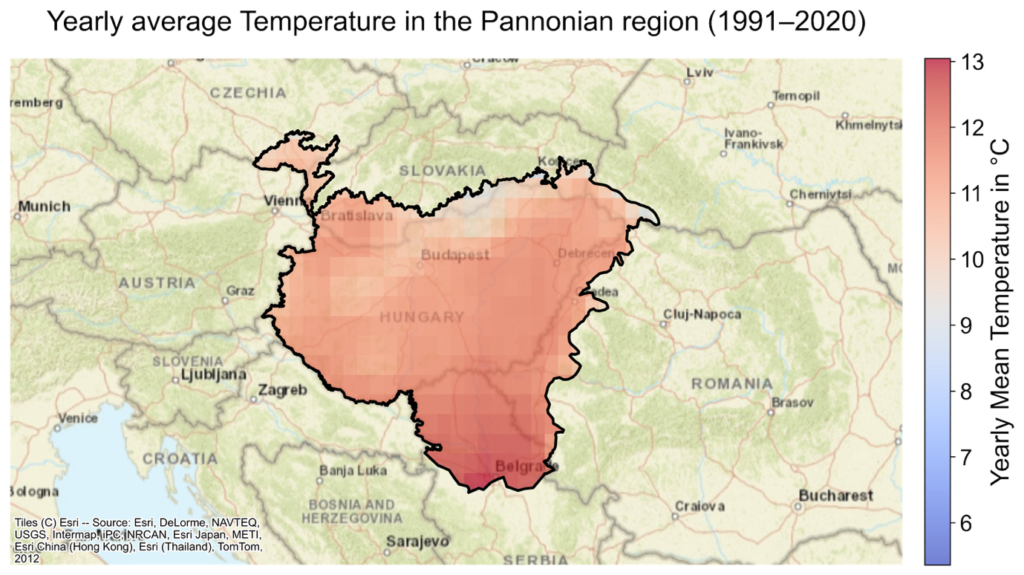
Figure 1:Average annual air temperature in the Pannonian region for the period 1991–2020, based on ERA5T reanalysis data retrieved via the meteoblue DatasetAPI.
What Climate Projections Tell Us (CMIP6 Scenarios)
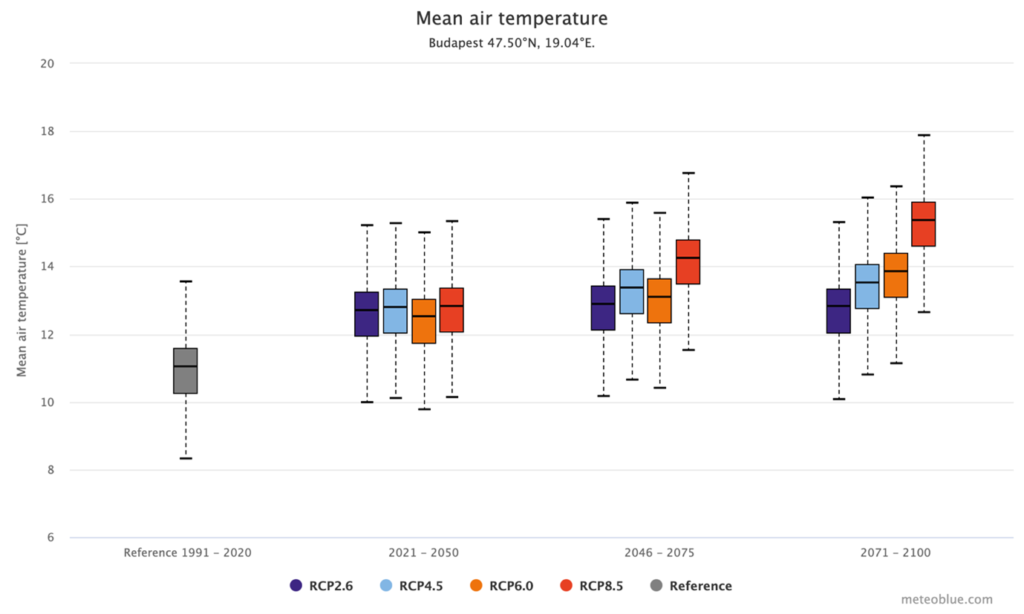
Climate projections are not weather forecasts for a specific day in the future—they are scientific “what-if” stories about how the climate could change depending on how much greenhouse gas humanity releases. These projections are created using complex computer models that simulate the Earth’s climate system, and CMIP6 is the latest international framework that brings many of these models together. Figure 2 shows how average yearly air temperature in Budapest could change under different CMIP6 scenarios, compared to the reference period 1991–2020. Each colored box represents a different future pathway: low emissions (RCP2.6), medium emissions (RCP4.5 and RCP6.0), and very high emissions (RCP8.5). The higher the emissions, the warmer the future becomes. While all scenarios show warming over time, the differences between them grow larger toward the end of the century. In simple terms, the image shows that future temperatures are not fixed—they depend strongly on the choices societies make today about energy use, emissions, and climate policy.
What Climate Projections Tell Us (CMIP6 Scenarios)
At meteoblue, we provide the high-resolution climate data needed to translate global climate change into actionable regional insights. Our Dataset API is designed to empower researchers, policymakers, and communicators with direct access to historical observations, reanalysis datasets, and CMIP6 climate projections for any location worldwide — such as the Pannonian basin. With automated retrieval of key variables like temperature, precipitation, and climate indices, users can efficiently build long-term trend analyses and produce compelling visuals, like annual temperature plots that connect past data with future scenarios. By integrating meteoblue data into your workflow, you can develop transparent, reproducible climate assessments that support impact studies, adaptation planning, and clear public communication of climate risks.
Explore the full capabilities through our:
Dataset API Configurator